Vector visualization overview
In addition to the common key components which we explored in the last section, we are going to explore how to visualize a vector data layer depending on the layer type in detail.
Types of vector data
- Polygon
- Line
- Point
Polygon layers
Represents enclosed planar features
- Land parcels
- Lakes
- Administrative boundaries
--
Polygon layers can be visualized as
--
- Polygon
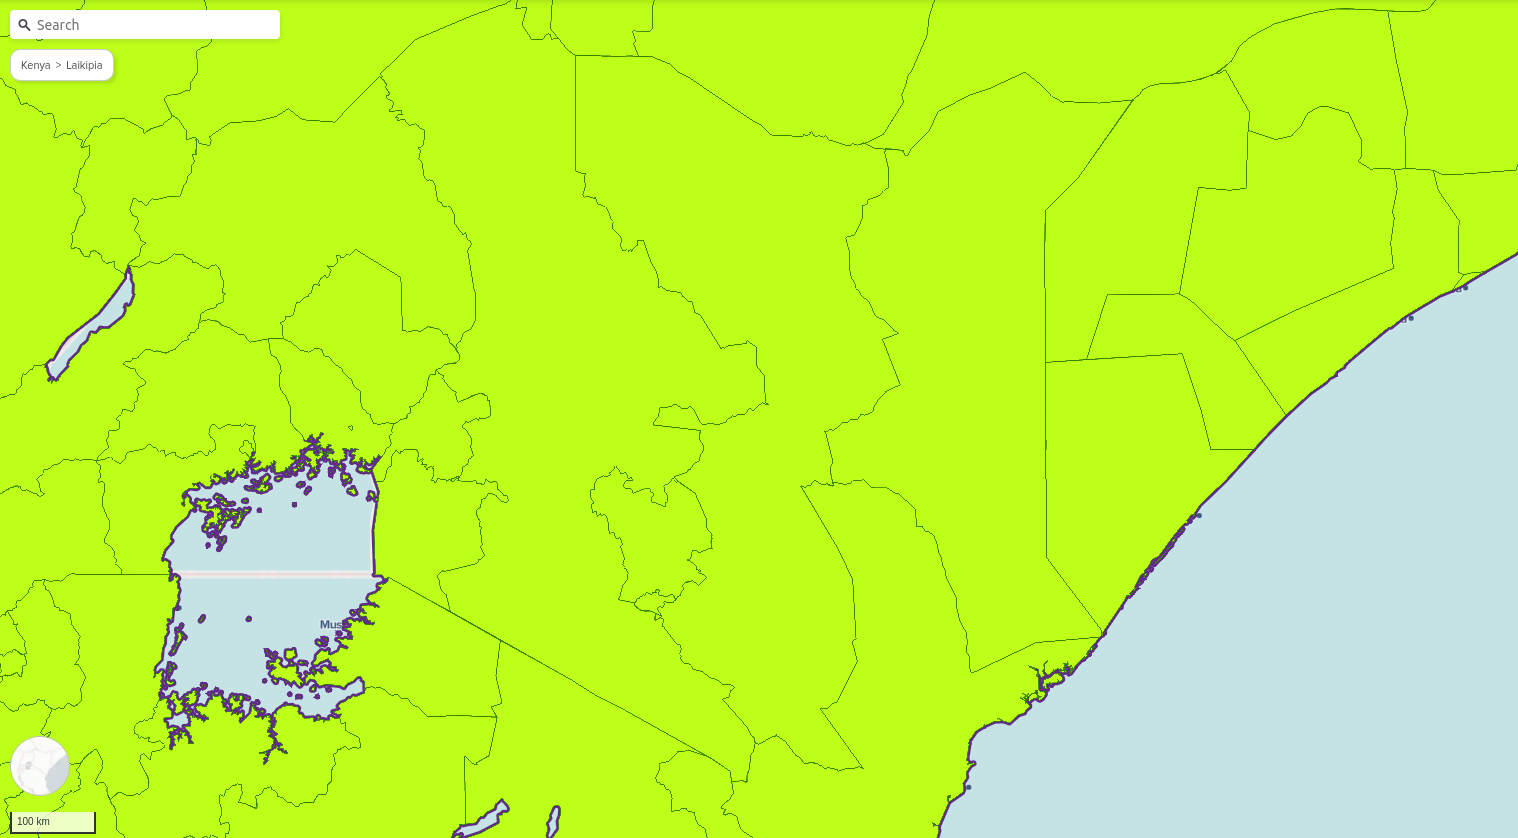
--
- 3D Polygon
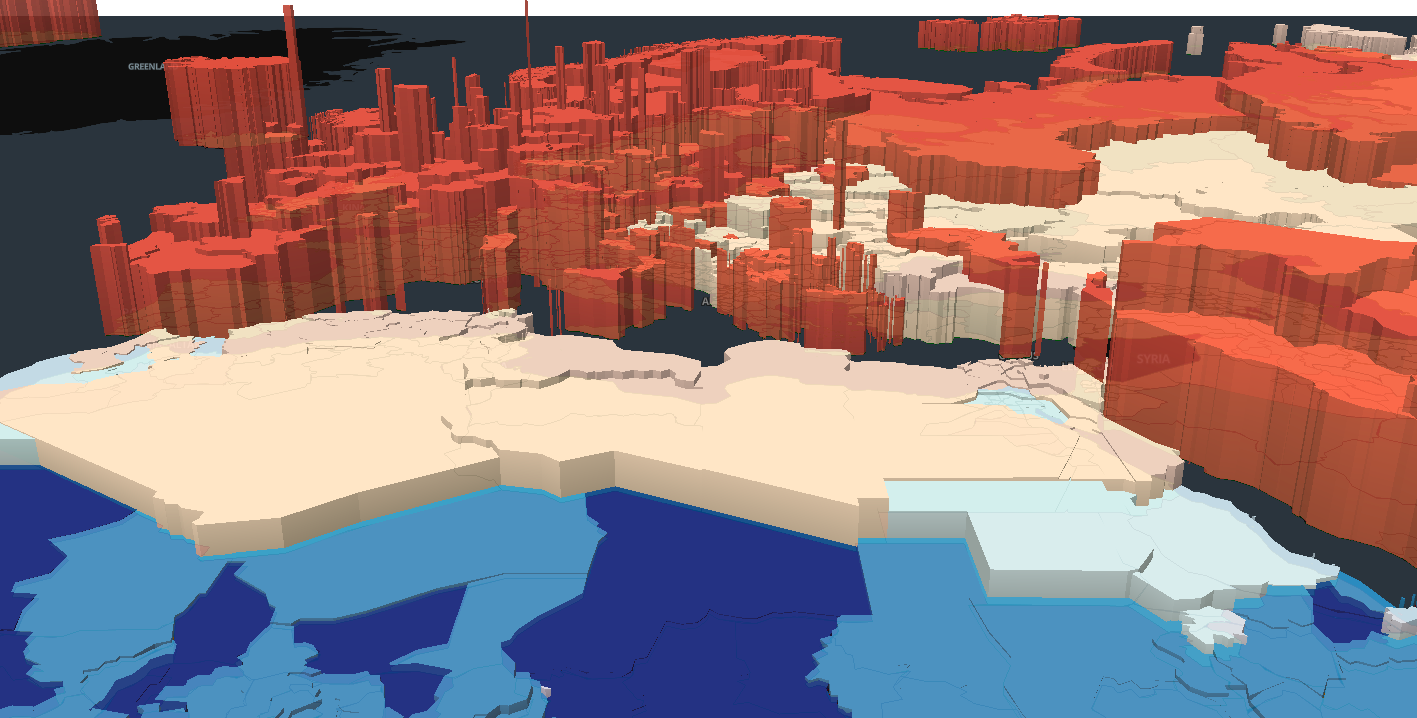
--
- Line
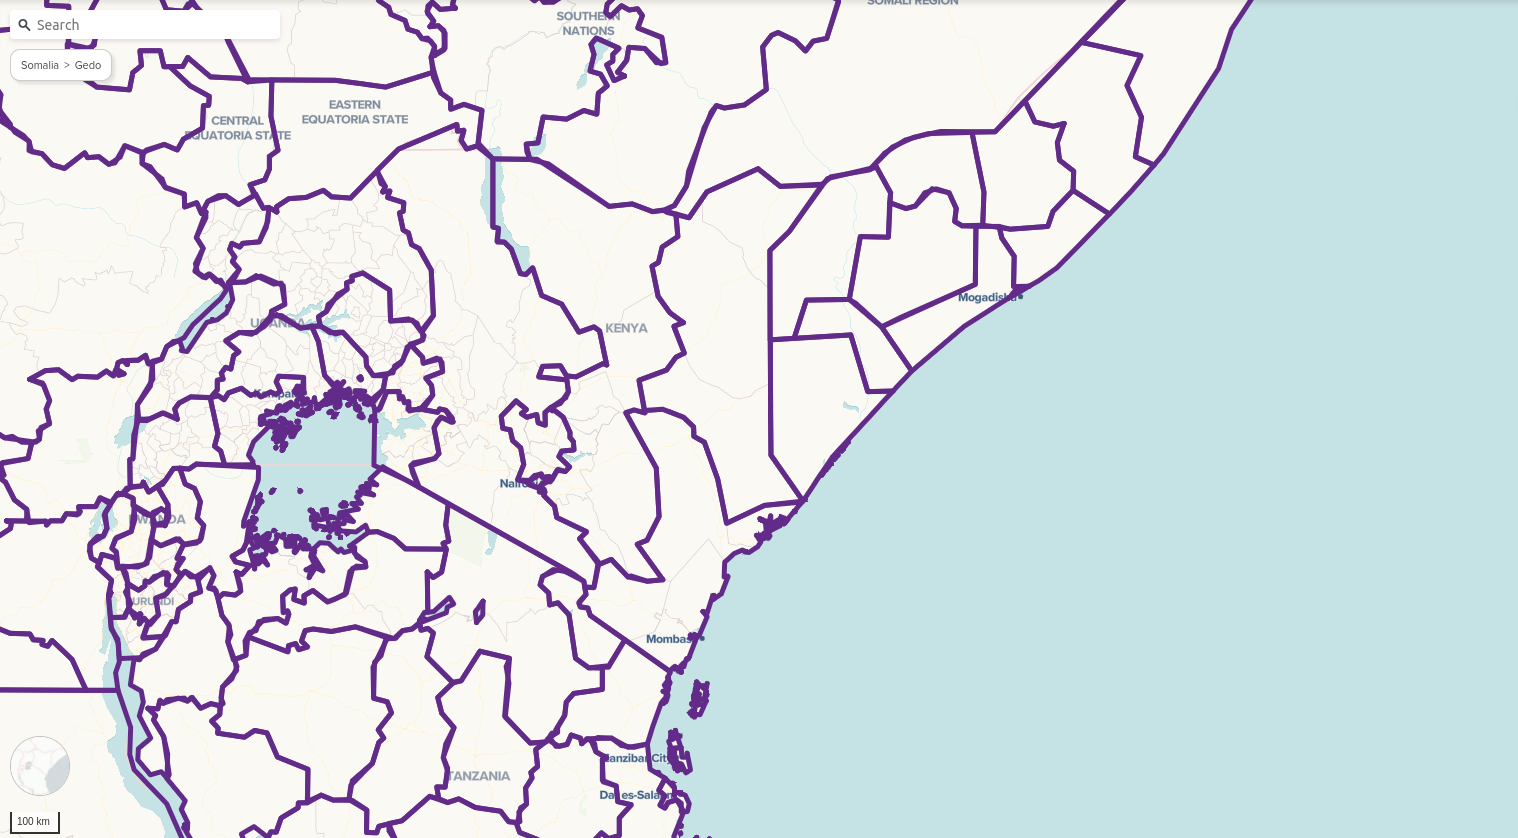
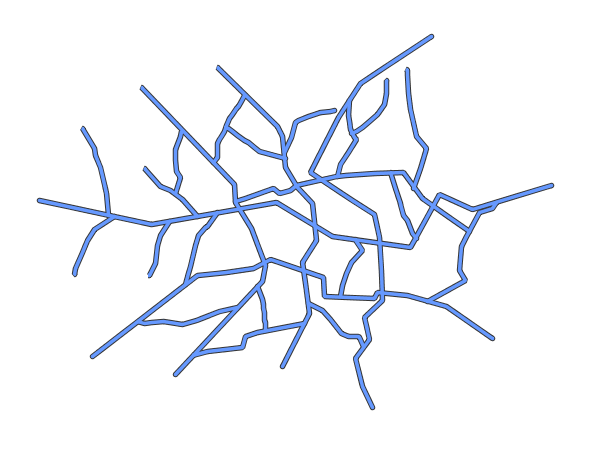
Line Layers
Represents linear features on maps.
- Roads
- Rivers
Point layers
Used to represent discrete locations or individual features.
- Fire hydrants
- Bus stops
--
Point
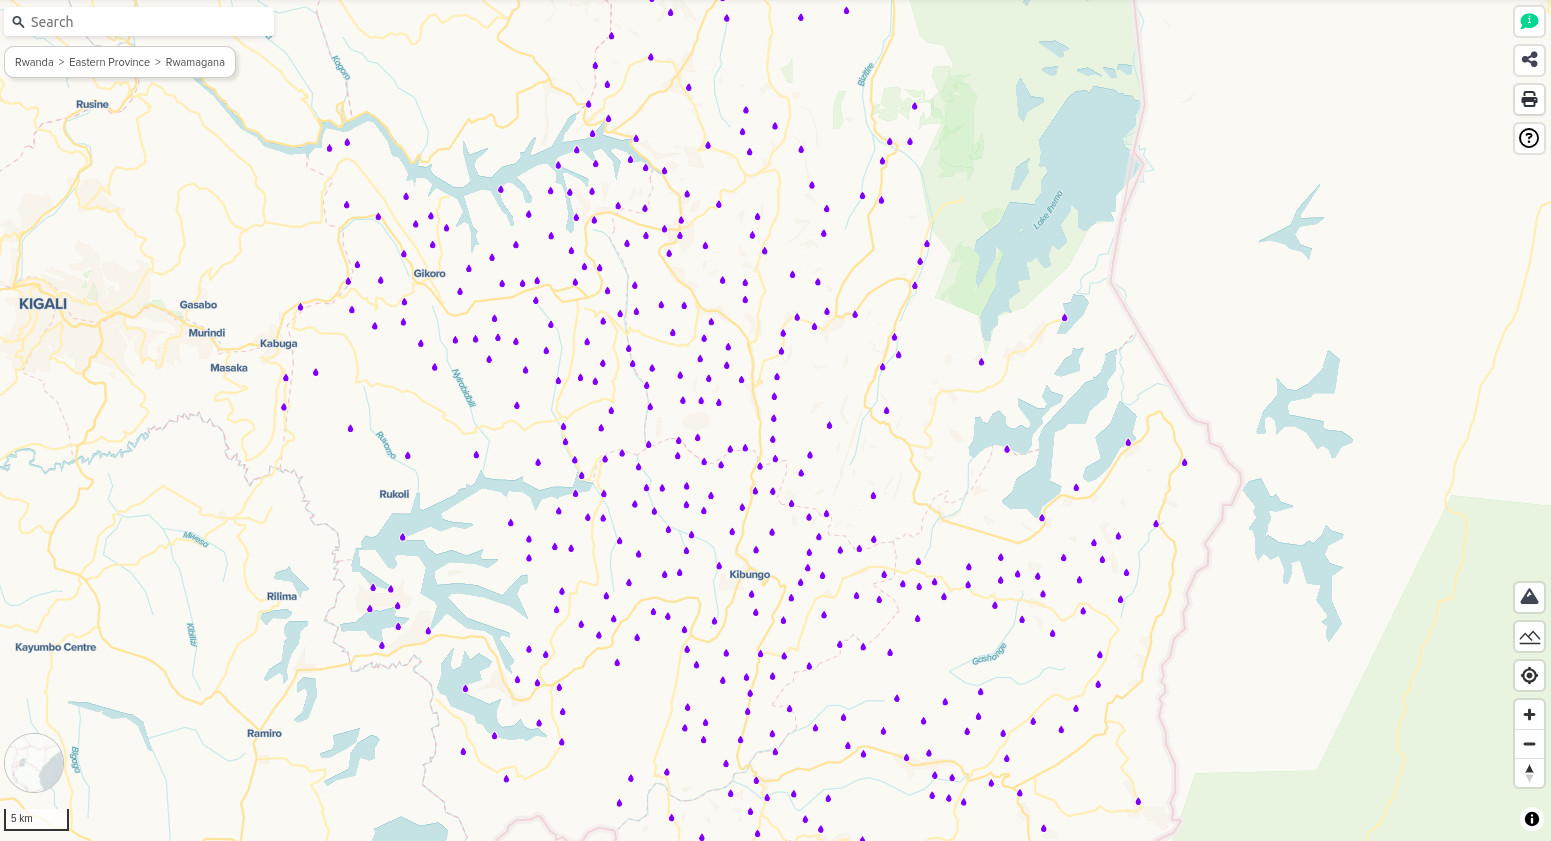
--
Heatmap
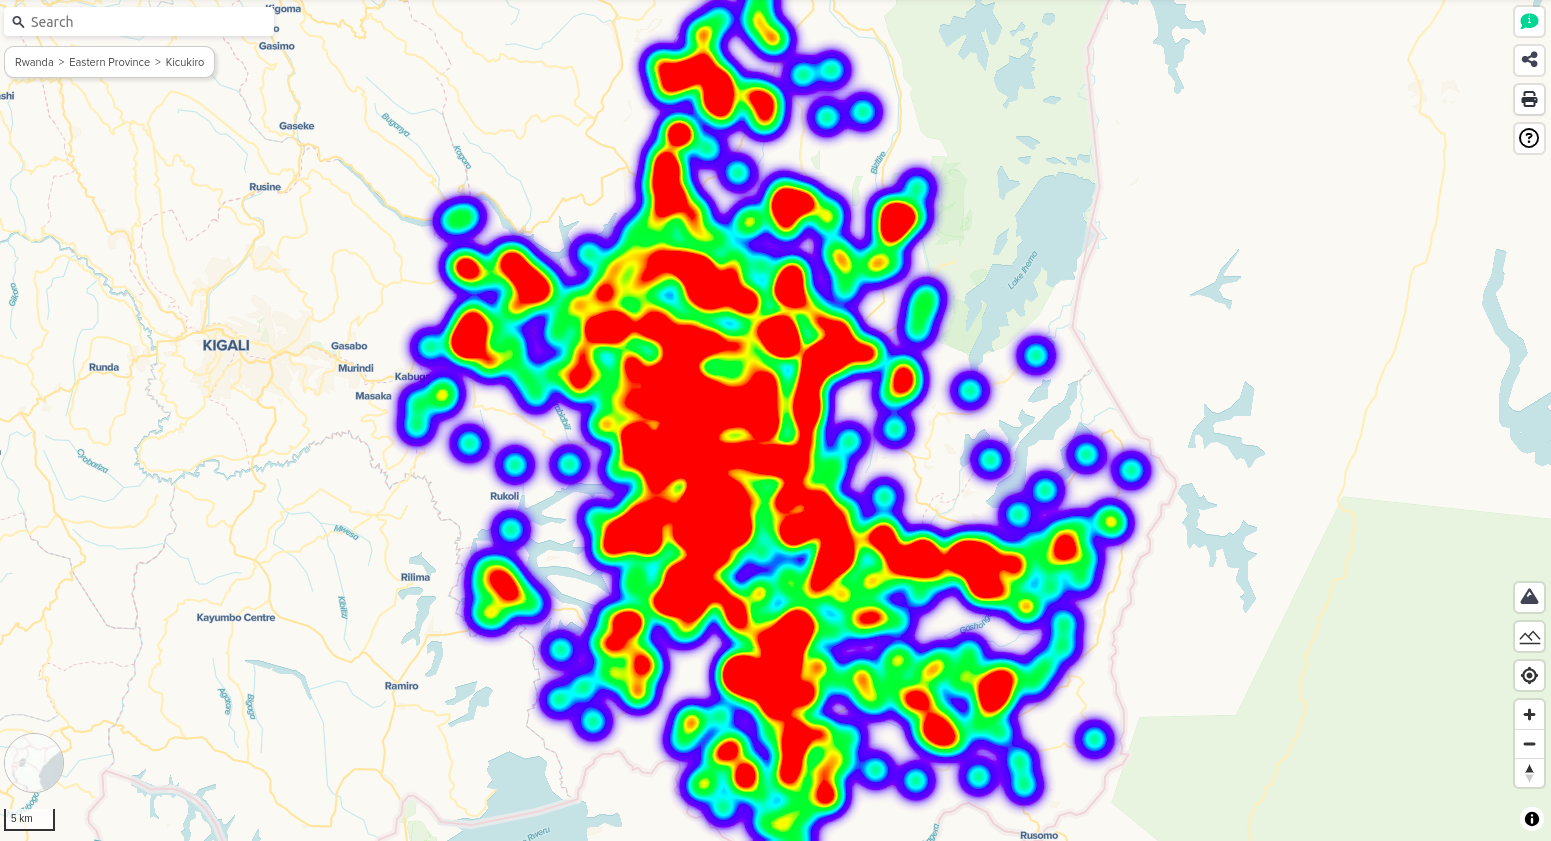
--
Circle
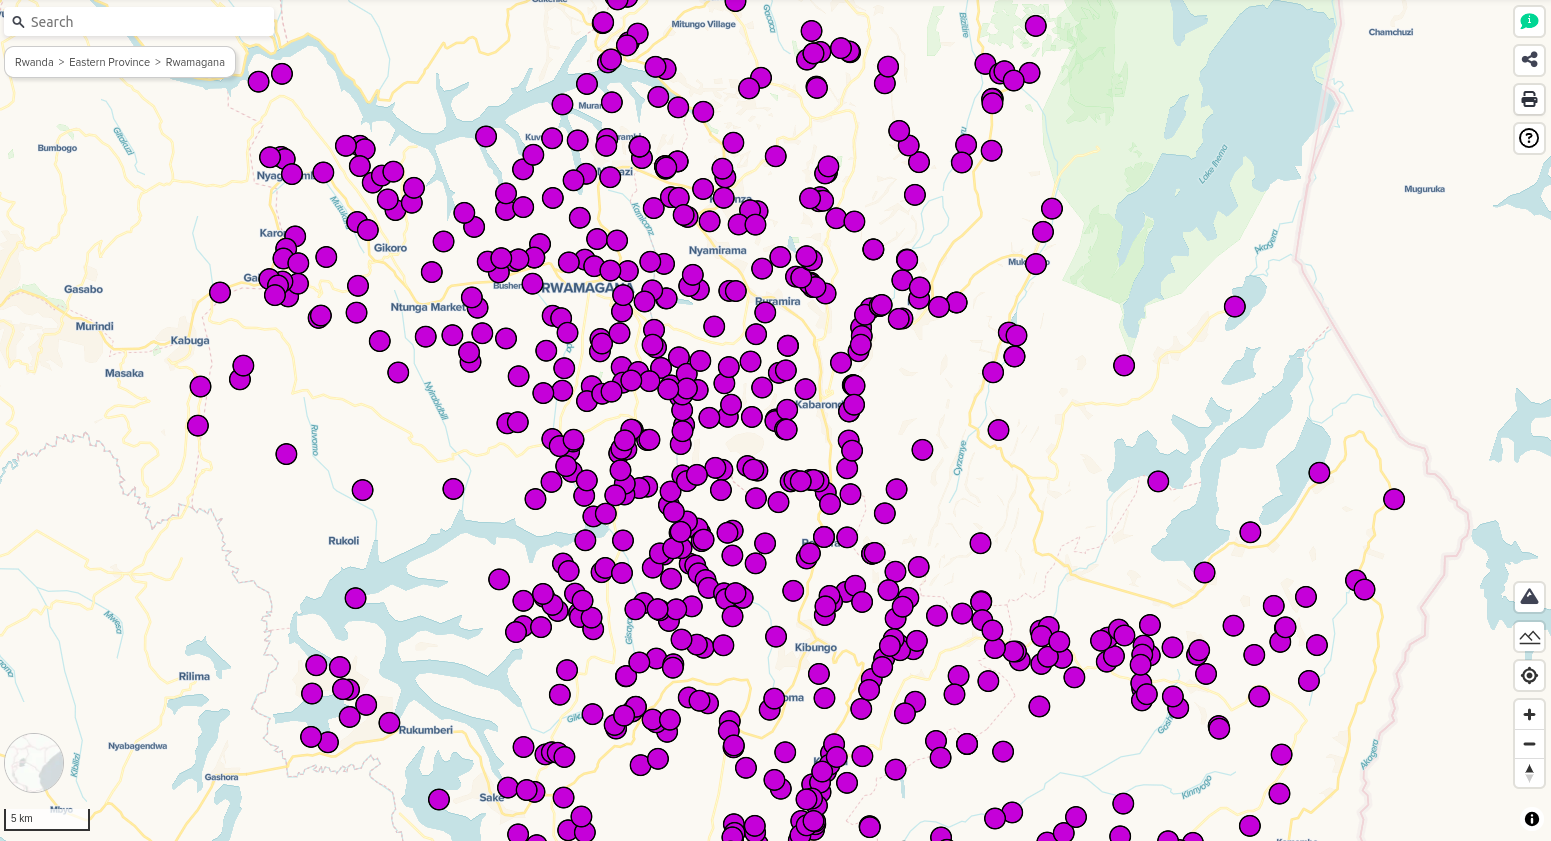
--
Before adding a dataset to map, you can select a layer type as shown in the below figure. You can add a data by clicking add layer button inside an accordion.
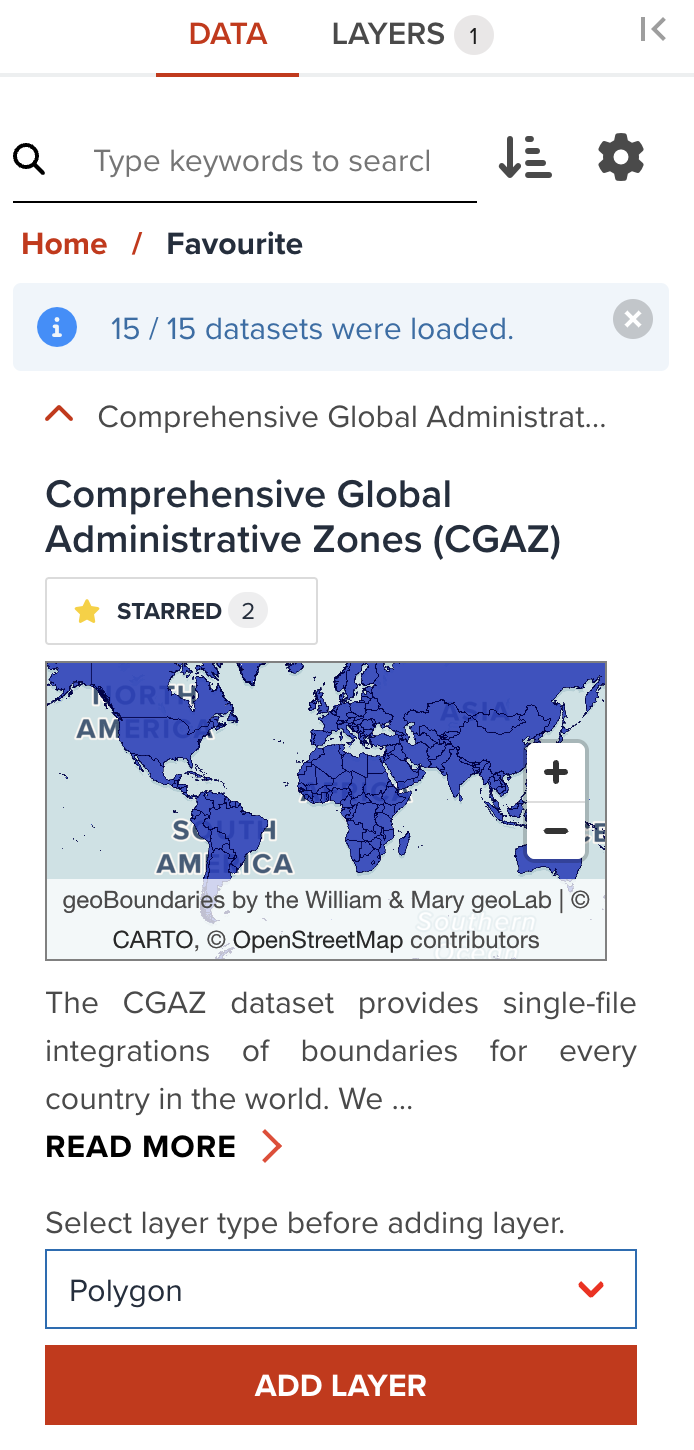
Style tab for each layer type
Style tab can provide you various properties to customize visualizing a data layer.
- Polygon: It is default layer type for Polygon data
- 3D Polygon
- Line: It is default layer type for Line data
- Point: It is default layer type for Point data
- Heatmap
- Circle
Filter tab for filtering data
GeoHub offers a feature to filter vector data layer. The steps of filtering is described here.
Label tab for adding information
Additional attribute information can also be added for a vector layer in GeoHub. The steps of adding labels is described here.
Next step
Let's start from polygon visualization at next section.